
The future of trucking in blockchain. Are you ready?
May 8, 2018
The Amazon Effect on wholesale delivery
May 21, 2018There is currently a lot of talk about big data and the IoT, however, it is important to understand the basics of data and analytics before a business can delve deeper into more complex analytics. Businesses are now collecting large amounts of structured data, or big data, to analyse and there is evidence that using analytics and goal setting effectively will lead to high performance in business. So it is important to get back to the basics and ensure you understand how to set KPIs (key performance indicators).
Once data is collected and combined, there are 4 ways in which this data can be processed. These are descriptive, diagnostic, predictive and prescriptive. The first two still involves a lot of human input, which means studying what actually happened. However, big data is playing a huge role in the predictive and prescriptive features. Predictive means getting a chance to use data to support decision making and prescriptive allows companies to see how big data can help prevent similar instances in the future.
Hence, not only is it important to know what to do once big data is collected, but the serious effort should be put into finding innovative methods of collecting big data. With the help of this data, actionable KPIs can be set through an informed and holistic approach. This helps monitor discrepancies and use quantifiable data to make decisions. The four main considerations when setting your company’s KPIs were discussed in the webinar we held recently.
Setting actionable KPIs
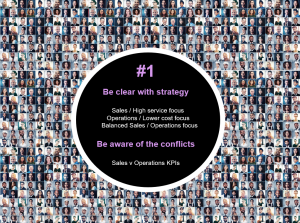
Different businesses vary in size, employees, and stakeholders. Because all of these factors vary quite a bit, KPIs should be set based on your business or company strategy – namely what the business wants to achieve. For example, is the company’s main focus is cost, service, safety or somewhere in between? When there is a question of savings involved, do you invest these savings back in or take out? A good way to plan this is to get opinions directly from the customers and discuss the findings with the stakeholders.
‘Plan’ along with ‘actual’ data
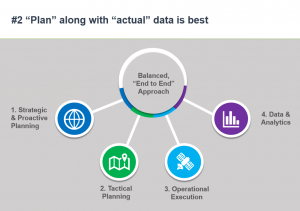
It’s always good to have a plan in place. For example for a transportation company, they might have one of their KPIs set to a certain number of kilometres travelled a day. However, having an idea of the actual data and then comparing that with the planned data to see where there might be a shortcoming is a good way to analyse where you stand regarding output. Telematics or mobility devices are important operational execution tools that can help you bring that data together.
There are four major steps to this; firstly, strategic and proactive planning, this involves setting goals according to where you want to be current as a company. Analyse the customer base and human as well as equipment resources to see where you are and where you want to stand, you can even have deadlines and timelines.
The second is tactical planning, which involves planning the tactics behind achieving the goals above. Thirdly, the operational execution that involves actually going ahead with the plan and the last is data and analytics which involves collecting data and analysing it based on the four features discussed in the beginning.
As mentioned before, a simple time study can go a long way when you want to find areas for improvement in your company.
Tips for performance measurement
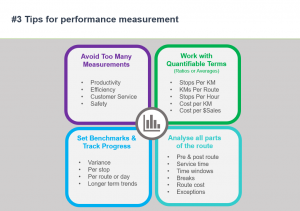
- Avoid too many measurements. It’s important to understand that while having large sums of data can help make informed decisions, it is imperative that the measurement that takes place is simple and easy to read. Take a lot of measurements, yes, but simplify the areas of measurement.
- Work with quantifiable terms, which are ratios or averages. This helps take the fluctuations out of the equation. Examples of these could be stops per kilometre, kilometres per route, cost per dollar of sales.
- Set benchmarks and track progress. Once you have made an improvement decision, it is important to track the changes and hence, see where you stand after a certain period. This can be done by setting benchmarks for comparison. Longer term trends help with creating a more informed variance and hence, you can set what an appropriate variance is and ultimately, reducing the variance between the actual and the desired value.
- Analyse all parts of a route. Suppose you are looking to decide what an appropriate variance between the actual and the planned value is. To do it, it is important to take into consideration all the various parts of the route.
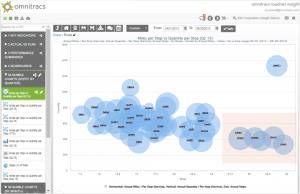
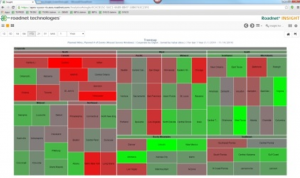
Tools that provide advanced visualisation
Once you have decided on using big data to make informed decisions and set KPIs across your company, is it important to find ways to analyse the data easily. This can be done by using graphs and other layouts that easily highlight important factors and allow you to study large amounts of data easily. It’s important to use tools that allow for advanced visualisations and also where you can visually drill down to the root cause. Also, consider products that are integrated with your software.
About us
Market Motion provide fleet management solutions, strategic consulting and software implementation. We work with you to grow your business, reduce your fleet costs, improve safety and customer satisfaction while giving you greater control and visibility into your operations.
-

- Australia, New Zealand, & Asia Pacific region